4. Assessment
4.1 Monitoring Student Progress & Performance
Student progress and performance are tracked automatically and detailed reports are instantly available on the Instructor Dashboard under Groups & Reports.
Instructors can view and compare summary results for all students in a Group. Clicking a student name displays a detailed Performance Report for the student.
Assessment is fully automated as described below.
4.2 Grading
To convert the GoVenture assessment into a course grade, compare the estimated hours required for each GoVenture activity to the total number of course hours, including homework. Then assign a grade percentage that reflects this proportion.
- For example, if your course requires 60 total hours and the GoVenture simulation and related activities take 6 hours, you might assign it at least 10% of the total course grade.
- If a GoVenture activity carries more weight or importance than other course components, consider assigning it a proportionally higher grade percentage.
4.3 Performance SCORE — Metrics & Weights
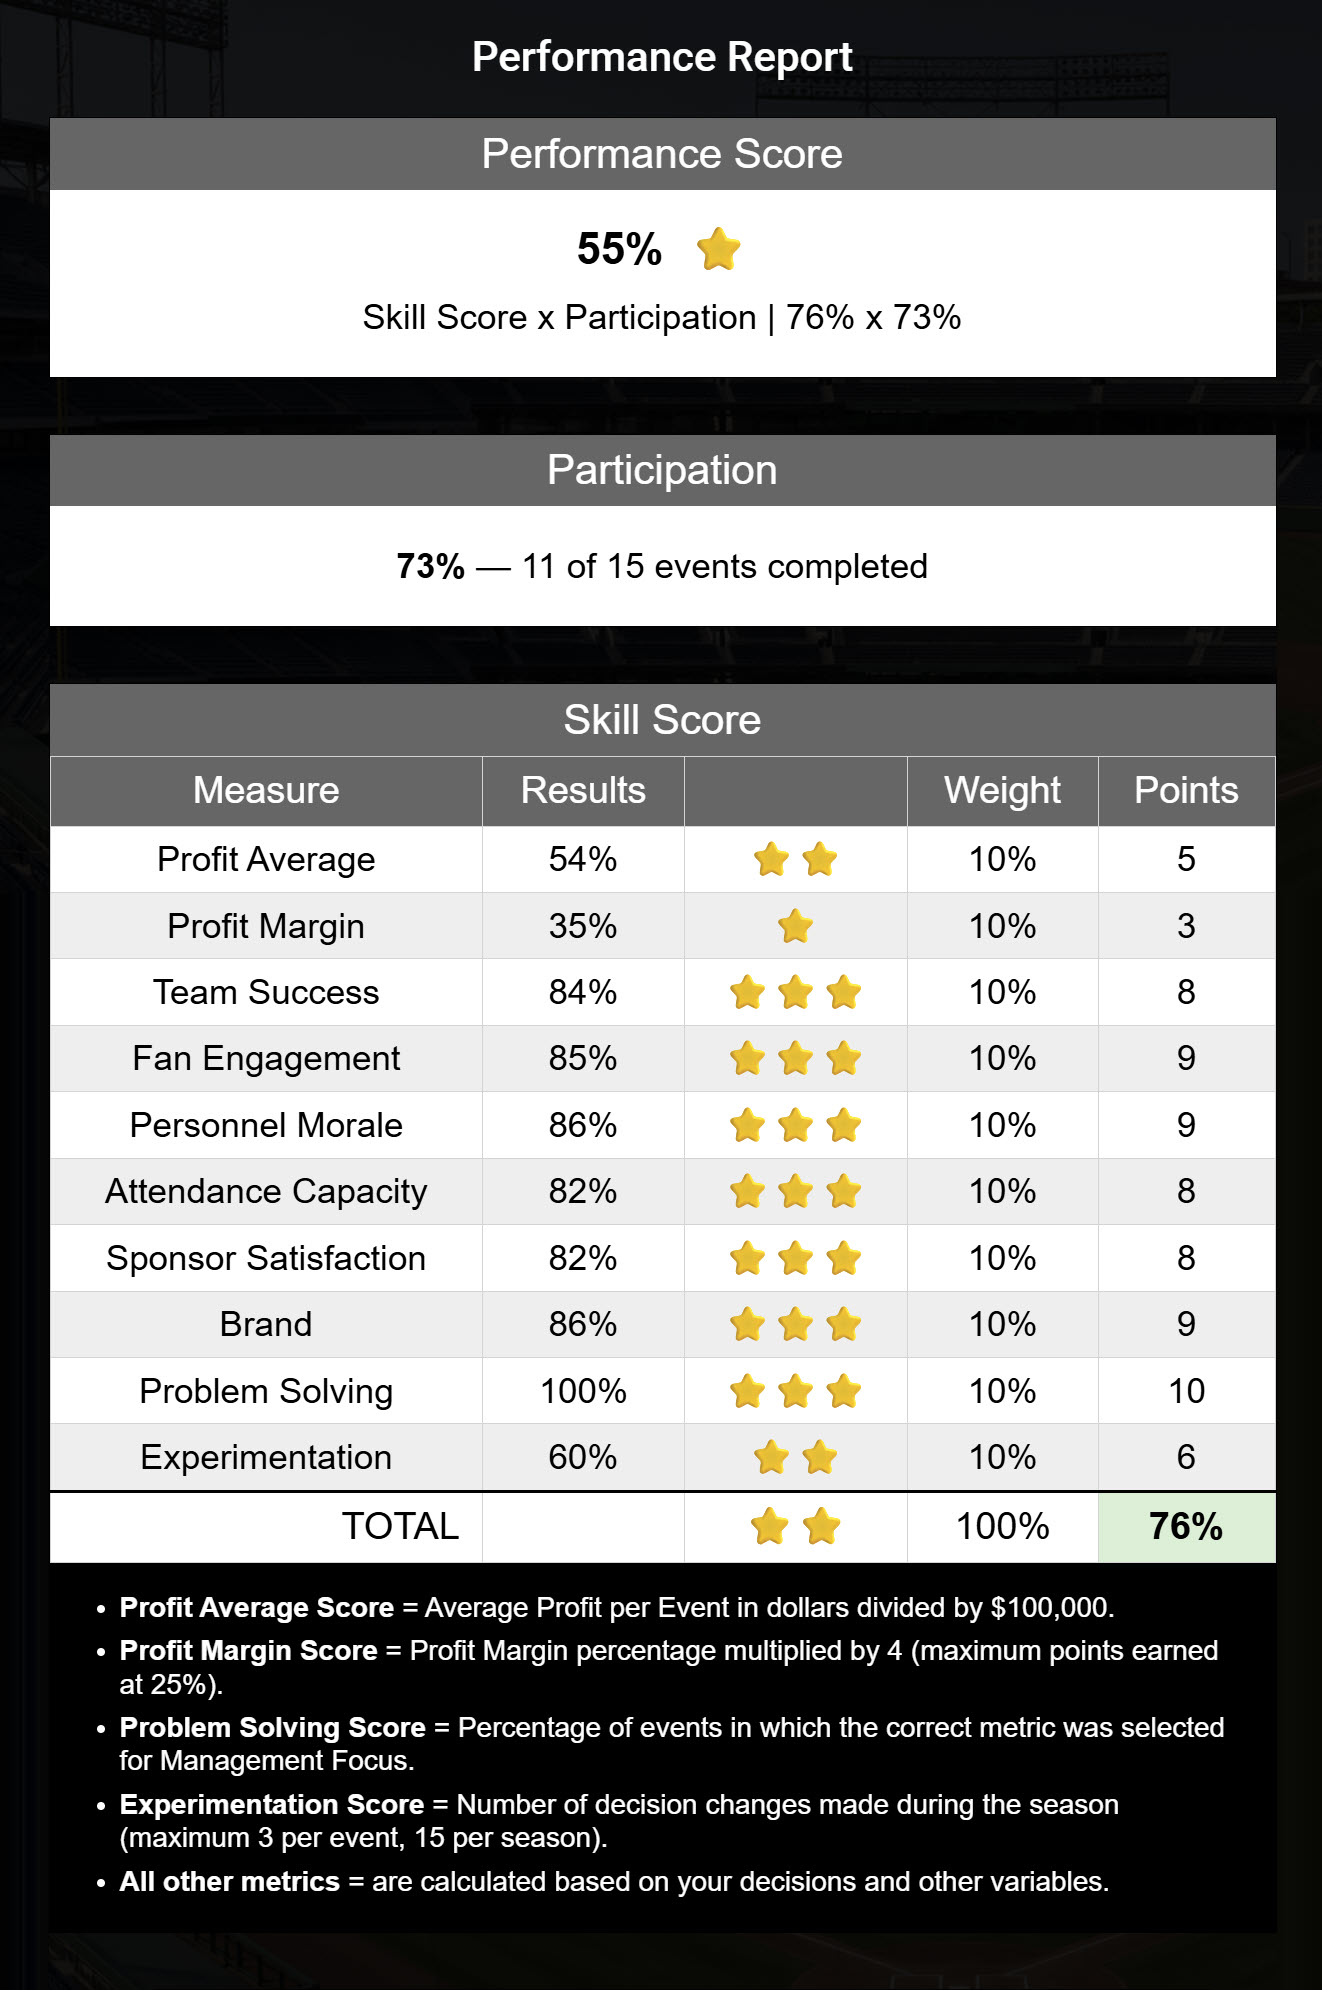
Assessment is fully automated and summarized in a Performance Score (0 to 100%) that is weighted across multiple metrics:
- Participation is a significant metric because it rewards students for putting in the time and effort to complete the activity. Students who do not fully complete the simulation will have a low Performance Score.
Skill is a holistic measurement of success using 10 metrics — see details below.
Each simulation (by Group) that students play is assigned a unique score.
4.4 Performance Report
The Performance Report provides a detailed view of student activity, but the only item that is needed by instructors for assessment is the Performance Score. Instructors may require the Strategy Journal — see details below.
Students can see their own reports in real time, but not those of other students.
4.5 Strategy Journal
See section 2.6 for details on the Strategy Journal.
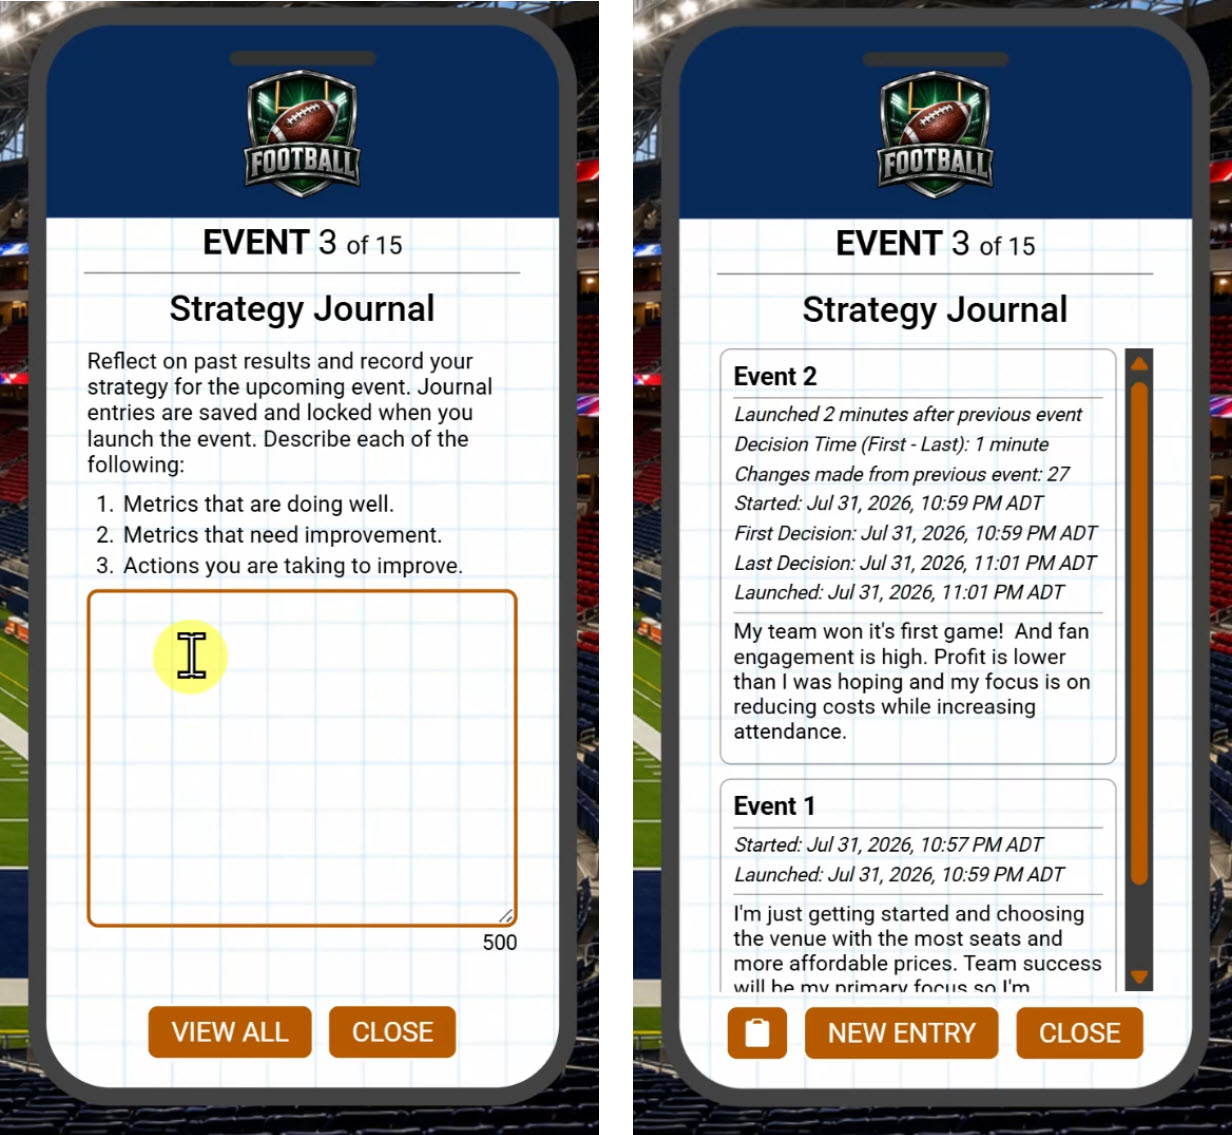
It is highly recommended that instructors make the Strategy Journal a required activity. The journal enhances learning, encourages critical thinking, and provides evidence of student work and effort. If assigned, consider splitting the grade between the Strategy Journal and the Performance Score, such as 50% each
Assessment is manual and requires reviewing journal entries. However, AI can be used to assist with evaluating the written responses and analyzing the available data to help assess the authenticity of the content. See details below. View Sample AI Assessment
Each journal entry includes the information in the table below to help assess student work and effort.
| Item | Evaluation | Caution |
|---|---|---|
| Student Notes | Students are prompted to answer this one question after each event: Reflect on past results and record your strategy for the upcoming event. Journal entries are saved and locked when you launch the event. Describe each of the following: (1) Metrics that are doing well. (2) Metrics that need improvement. (3) Actions you are taking to improve. |
Students should provide accurate and thoughtful answers. AI can be used to assist with this evaluation — see details below. |
| Time Between Events | Shorter times between events may indicate less time spent planning and reflecting. | Students may leave the simulation open and idle, which can overstate the amount of time spent. |
| Changes from Previous Events | Meaningful changes may indicate experimentation and strategic adjustment. | Changes may also result from random selections rather than thoughtful decision-making. |
| Decision Time | The time from the first decision to the last decision made during an event. Short decision times may indicate limited planning or reflection. | Students may plan decisions ahead of time and then enter them quickly. |
| Started | Timestamp showing when the event became available for planning, such as when the simulation was opened or the previous event was completed. | - |
| Launched | Timestamp showing when the LAUNCH EVENT button was clicked. | - |
Using AI to Assess the Strategy Journal
AI can assist you with reviewing student Strategy Journal entries and comparing them with simulation results. The AI assessment should be used as a grading aid, with the instructor retaining final responsibility for the grade.
How to Use AI To Do Assessments
Open the AI tool of your choice, such as ChatGPT, Claude, Gemini, or Copilot.
Start a new conversation for the assessment.
Copy and paste the Strategy Journal Evaluation Prompt provided in the grey box below. You only need to provide this prompt once at the beginning of the conversation.
Copy the assessment data for one student from GoVenture and paste it into the same AI conversation. To get this data from your Instructor Dashboard, click Groups & Reports then View Performance Reports then click a player name. You will see this orange button that will copy all the required assessment data to your clipboard —

The AI will review the student's journal entries against the actual simulation results and provide:
- An overall score from 0% to 100%.
- A summary of the student's analysis.
- Strengths and areas for improvement.
- Evidence supporting the assessment.
- A recommendation for instructor review when appropriate.
- A confidence level for the assessment.
Review the AI assessment before assigning a grade. Pay particular attention to assessments with a Medium or Low confidence level or those that recommend instructor review.
To assess another student, paste that student's simulation results and Strategy Journal data into the same conversation. The AI should continue using the original evaluation instructions and assess each student independently.
Important
AI assessment is intended to reduce instructor workload and assist with identifying evidence of student analysis and decision-making. It should not be treated as definitive proof of student effort, authenticity, or academic integrity.
Instructors should use their own judgment when determining final grades, particularly when the AI identifies inconsistent or insufficient evidence.
Copy This AI Prompt
# Strategy Journal Evaluation Prompt

## Role
Act as an instructor teaching **Sports & Entertainment Management** to high school or college students.
Students have completed a business simulation in which they acted as the **President & General Manager** of a new professional sports organization. Their objective was to manage a successful and profitable first season by making strategic decisions before each event.
Before every event, students completed a **Strategy Journal** by answering the following questions:
1. Describe which metrics are doing well.
2. Describe which metrics need improvement.
3. Describe the actions you are taking to improve results.
Each response is limited to **500 characters**.

---

## Objective
Evaluate whether the student's journal entries demonstrate that they analyzed the simulation results and made strategic management decisions that are consistent with those results.

Your objective is **not** to determine whether the student made the best decisions. Instead, determine whether the journal provides evidence that the student thoughtfully analyzed the simulation and documented reasoning that is consistent with the available data.

Evaluate **each student independently**. Do **not** compare one student to another. Apply the same evaluation criteria consistently to every student.

---

## Evaluation Process
1. Review each event independently by comparing the Strategy Journal entry with the corresponding simulation results.
2. Identify strengths and weaknesses for that event.
3. After reviewing all events, evaluate the student's performance across the entire season.
4. Assign one overall score from **0% to 100%**.

Do not allow one particularly strong or weak event to disproportionately influence the overall evaluation.

---

## Evaluation Criteria
For each event, consider whether the student:

- Correctly identifies metrics that are performing well.
- Correctly identifies metrics that need improvement.
- Describes actions that logically address the identified issues.
- Demonstrates an understanding of how management decisions influence performance metrics.
- Adjusts strategy as simulation results change throughout the season rather than repeating the same observations.
- Provides responses that are specific to the simulation rather than generic business advice.

Do **not** assess writing quality, grammar, spelling, vocabulary, or response length unless they prevent understanding. Focus on the student's analysis, reasoning, and decision-making.

---
## Indicators of Authentic Engagement

Positive indicators include:

- References to actual simulation results or trends.
- Logical connections between performance metrics and management decisions.
- Strategy changes that correspond to changing circumstances.
- Consistent reasoning throughout the season.
- Evidence that decisions are based on previous results.

Potential concerns include:

- Generic responses that could apply to almost any business simulation.
- Statements that contradict the simulation results.
- Random or unrelated content.
- Repeating nearly identical observations or actions throughout the season despite changing results.
- Little or no evidence that the student analyzed the available data.

Do **not** conclude that a student intentionally acted dishonestly. Instead, identify evidence that suggests the submission should be reviewed by the instructor.
---

## Scoring
Assign one overall score from **0% to 100%** based on the quality, consistency, accuracy, and progression of the student's analysis throughout the season.

Use the following general guidelines:

| Score | Description |
|------:|-------------|
| 90–100% | Excellent analysis. Journal consistently reflects simulation results and demonstrates thoughtful strategic reasoning. |
| 75–89% | Good analysis with only minor inconsistencies or missed opportunities. |
| 60–74% | Adequate analysis. Some observations are accurate, but reasoning is inconsistent or lacks depth. |
| 40–59% | Limited analysis. Frequent generic responses or weak connections to simulation results. |
| 0–39% | Very little evidence that the journal reflects the simulation results. Responses are largely generic, contradictory, repetitive, or unrelated. Instructor review is recommended. |

---
## Output Format
Provide the evaluation in the following format.

# Student Evaluation

## Overall Score
**XX%**

## Summary
Provide a brief overall assessment of the student's strategic thinking and analysis throughout the season.

## Strengths
- ...
- ...
- ...

## Areas for Improvement
- ...
- ...
- ...

## Evidence
Provide specific examples from the journal and simulation results that support your evaluation.

## Recommendation
Choose **one**:
- ✅ Accept as authentic
- ⚠️ Borderline — instructor review recommended
- ❗ Inconsistent with simulation results — instructor review recommended

## Confidence
Choose **one**:
- **High** – The journal provides clear and consistent evidence supporting the evaluation.
- **Medium** – The evaluation is generally supported, but there are some ambiguities or limited evidence.
- **Low** – The available information is insufficient or contradictory, making the evaluation uncertain. Human review is strongly recommended.
Briefly explain why you selected this confidence level.
---
## Instructions
Wait until the simulation results and Strategy Journal for **one student** have been provided before beginning the evaluation.
Evaluate each student separately using these same instructions.
The simulation results and Strategy Journal will be provided in Markdown. Preserve this structure when referencing the information in your evaluation.