9. Assessment
GoVenture Entrepreneur includes multiple assessment options to choose from, enabling instructors to perfectly match their grading and performance preferences. Watch this 12-minute video to discover how to set up GoVenture Entrepreneur for your course and review student assessment methods.
9.1 Assessment Methods
9.1.1 Summary
| METHOD | DESCRIPTION |
|---|---|
| Simulation PARTICIPATION | Participation means playing a required number of Simulation Days. Participation is typically the heaviest weighted assessment metric. |
| Simulation SKILL |
A holistic measure of business success is calculated with a Skill Score. |
| Competition | Comparison of student SKILL scores or PROFIT with other students in the same class or cohort. |
| Microlearning | Completion of required Microlearning Modules and related quiz scores. |
| Student Experience Report or Presentation | Students prepare written, live, or video presentations or reports on their experience playing the simulation and business decisions and strategy. Or have students evaluate each other's performance. A template is available in section 9.1.2. |
| Team Evaluation | Award points based on how each student is evaluated by their teammates. You can also have individuals evaluate themselves for self-reflection. See section 7 for how to apply team play and section 9.7 for assessment. |
| Activities | Printable activities can be assigned and graded. |
9.1.2 Details
View the table above with full details.
Expand this section — click the black triangle
| METHOD | DESCRIPTION |
|---|---|
| Simulation PARTICIPATION | Participation should be the heaviest weighted assessment metric. Participation means playing a required number of Simulation Days. On average, it takes 1 hour to play 30 Simulation Days for Lemonade Stand, 1.5 hours for Kiosk Business, and 2 hours for Full Business. Play cannot be automated, meaning that students remain engaged by being required to continually make decisions in the simulation. Making poor decisions or avoiding decisions will lead to bankruptcy and require the student to start over. A student that keeps the business running for many business days demonstrates, at minimum, a satisfactory level of work and performance. Profitability and other metrics demonstrate the degree or level of business success achieved and can also be used for performance comparisons with other students. |
| Simulation SKILL |
A holistic measure of business success is calculated with a Skill Score. All key business metrics in the simulation are tracked and reported. Business metrics include Days in Business, Profit, Profit Margin, Cash, Revenue, Expenses, Assets & Liabilities, Equity, Customer Satisfaction, Employee Morale, Health, and more. See below for how SKILL is calculated. See further up in this document how team play can be assessed. |
| Competition | If competition is important to you, compare student SKILL score or PROFIT with other students in the same class or cohort. Consider how the Global Leaderboards can be used to further motivate and reward students. |
| Microlearning | GoVenture is enhanced with over 100 microlearning modules that introduce business concepts using video and other media supported with knowledge checks and quizzes. Students earn 1 star for completing a microlearning module with 1 mistake made on the quiz questions for that module, or 2 stars if no mistakes made. 0 stars are earned otherwise. A student earning 2 stars on all microlearning modules (chosen by the instructor) will earn 100% while a student earning 1 star on all modules will earn 70%. A mix of stars will earn students a score in between 70% to 100%. |
| Student Experience Report or Presentation | Students prepare written, live, or video presentations or reports on their experience playing the simulation and business decisions and strategy. Encourages students to reflect on their simulation experience and what they learned, and then organize and present their thoughts. A report template is available in Google Slides, which you can download, edit, and send to students (using your school LMS or other method). The questions in this template are for the Full Business so you may need to remove some questions if your students only played Kiosk or Lemonade Stand. You may also consider having students evaluate each other's performance. Click here to view the template (do not share this link with students). |
| Team Evaluation | Award points based on how each student is evaluated by their teammates. You can also have individuals evaluate themselves for self-reflection. See section 7 for how to apply team play and section 9.7 for assessment. |
| Activities | Printable activities can be assigned and graded. |
| Test Bank | Quiz questions aligned with the Business Learning & Activity Book are available to instructors as a Google document (upon request). The Test Bank should only be considered if the Microlearning module is not used. |
9.1.3 Details
If you need to calculate points for grades or transfer them to a learning management system, all reports and data tables in GoVenture can be copied to a spreadsheet — this video shows you how.
9.2 Rubric Score & Sample Assessment Formula
- Rubric Score — Group settings allow you to set a scoring formula, similar to the examples shown below. The Rubric Score will be automatically generated and appear on the Performance Reports available to instructors and students.
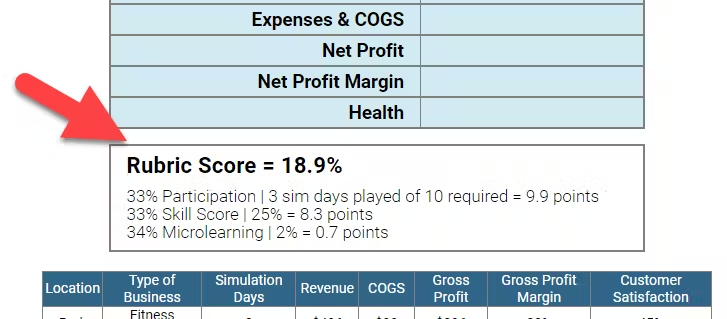
The Rubric Score can include Participation, Simulation Skill, and Microlearning.
Participation measures the number of Simulation Days played. Example — You assign students to play 60 Simulation Days. A student who plays 60 (or more) will earn 100%, whereas a student that only plays 30 will only earn 50% of the points for Participation.
With GoVenture Entrepreneur, students who run their businesses successfully without running out of money (going bankrtupt) are demonstrating reasonably good decision making. The simulation cannot be automated, so you are assured that students are fully engaged and putting in the work. They should be rewarded for this.Simulation Skill rewards students who demonstrate more effort and better business results. This is measured by the student Skill Score earned while playing (see section 9.6 for details on the Skill Score).
It is recommended that the Rubric Score percentage applied to the Skill Score be no more than 50% of the Simulation Days to be played. Example— If you expect students to play 60 Simulation Days, set the Performance (Skill Score) to 30% or less. The reason for this is that the Skill Score becomes more accurate with the more Simulation Days played.The following formula is recommended for Lemonade Stand and Kiosk:
| 50% Participation (Days Played) |
+ | 50% Performance (Skill Score) |
- The following formula is recommended for Full Business:
| 70% Participation (Days Played) |
+ | 30% Performance (Skill Score) |
- The following formula is recommended for practice simulations:
| 100% Participation (Days Played) |
Microlearning assessment has the following considerations:
- When playing multiple simulations (multiple Groups), it is best to exclude Microlearning from the Rubric Score so it can be assessed separately. This makes it easier to align grade points with the level of effort.
- The more modules required, the more time it takes students to complete. Therefore, a higher assessment percentage is typically assigned so that the grade better reflects the level of effort.
- The automated Microlearning assessment (using quizzes) is not as robust as playing the simulation. Microlearning is intended to provide foundational knowledge, while the simulation assesses skills and competencies.
- When playing multiple simulations (multiple Groups), it is best to exclude Microlearning from the Rubric Score so it can be assessed separately. This makes it easier to align grade points with the level of effort.
9.3 Adding Competition
An effective way to increase fun and performance is through competition. Use the Skill Score, Net Profit, or other metric to rank students in the same group. Here is one possible measure:
- Top 10% earn 10 points
- Top 25% earn 7 points
- Top 50% earn 5 points
- Top 75% earn 3 points
- All others earn 0 points
If you choose to award cash, gifts, or other prizes, we recommend that you choose a larger number of winners for small prizes, rather than a few winners of larger prizes. This will motivate a higher number of participants to do well, while also minimizing any perceived unfairness that could arise with a larger prize.
Instructors can control which types of businesses students may choose for Kiosk and Full Business. This feature is useful if you want consistency or are hosting a competition and prefer that all students choose the same type of business. Running the same type of business is not required for hosting a competition but maximizes fairness. This is specifically important with Full business where there are businesses types with three levels of difficulty to choose from. Business types are described in section 6.2.
Consider how the Global or Group Leaderboards can be used to further motivate and reward students (see section 6.8).
The above are suggested examples — instructors should use their preferred assessment methods and weightings. Note that formulas like the above must be manually calculated by the instructor using a spreadsheet or other method.
9.4 Performance Report — Summary
Each of the three business levels is tracked and scored independently.
Each student in a Group is listed in summary tables for easy evaluation and comparison — see examples below.
Lemonade Stand Business
| Player & Business Name | Days Played | Number of Stands | Quantity Sold | Sales Revenue | Expenses & COGS | Profit | Profit Margin | Skill Score |
|---|---|---|---|---|---|---|---|---|
| Student Name Business Name |
# | # | # | $ | $ | $ | % | % ★★★ |
Kiosk Business
| Player & Business Name | Type of Business | Days Played | Revenue | Expenses & COGS | Profit | Profit Margin | Health | Skill Score |
|---|---|---|---|---|---|---|---|---|
| Student Name Business name |
Bus. Type # Kiosks | # | $ | $ | $ | % | % | % ★★★ |
Full Business
| Player & Business Name | Type of Business | Days Played | Revenue | Expenses & COGS | Profit | Profit Margin | Health | Skill Score |
|---|---|---|---|---|---|---|---|---|
| Student Name Business name |
Bus. Type # Locations | # | $ | $ | $ | % | % | % ★★★ |
Microlearning
| Player | Topics Completed | Percent Completed | Score | Grade Points Rating: ★★1.5 ★0.7 |
|---|---|---|---|---|
| Student Name | # | % | % | # |
9.5 Performance Report — Detail
In addition to the summary tables listed above, detailed Performance Reports are available for each student.
The detailed Performance Reports include in-depth information and financial reports for each of the three business levels.
9.6 Skill Scores
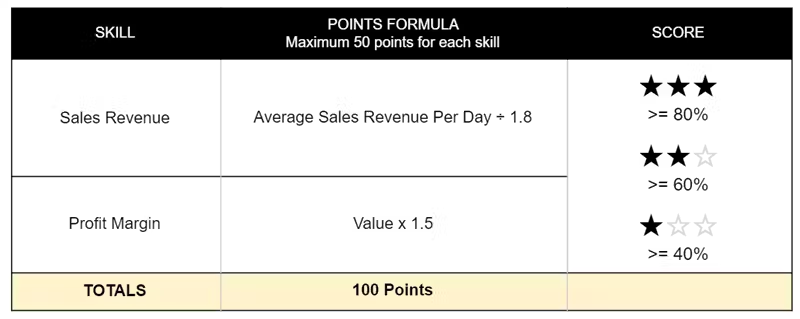
Each skill is scored as shown in the table below.
Each major skill is made up of the scores of the sub-skills underneath it. Each major skill is weighted by a certain percentage to determine the overall Skill Score.
Note that a Skill Score above 90% is difficult or impossible to achieve because metrics may inversely influence each other. For example, increasing Health by working less will likely result in lower revenue and profit.
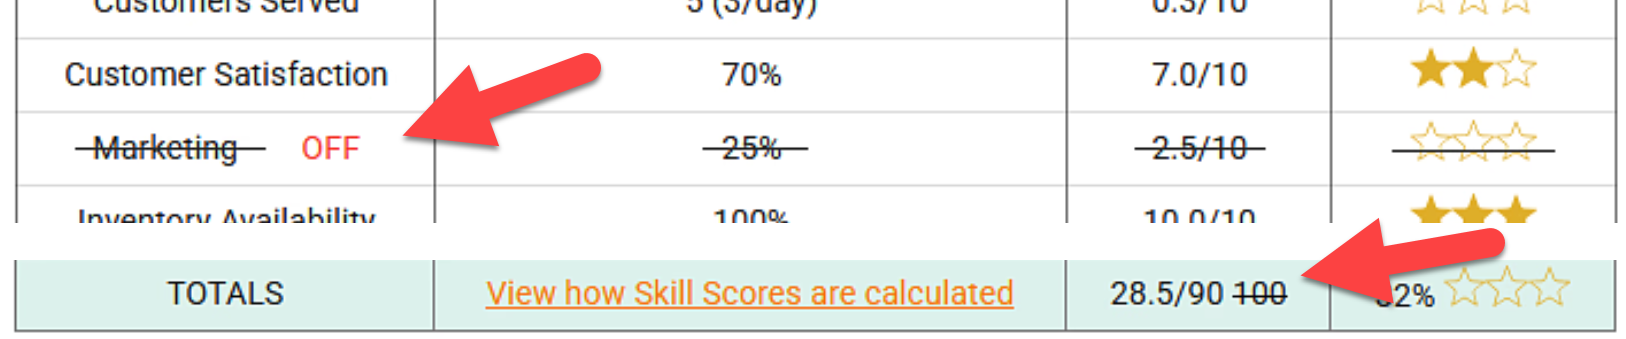
If a business module is turned OFF (see section 6.3), it will not be included in the Skill Score and will appear as shown in the screenshot below. The Total Score will be adjusted accordingly. If a module is initially OFF and then turned ON, the scores will update automatically to include the new module.
Lemonade Stand
Kiosk Business
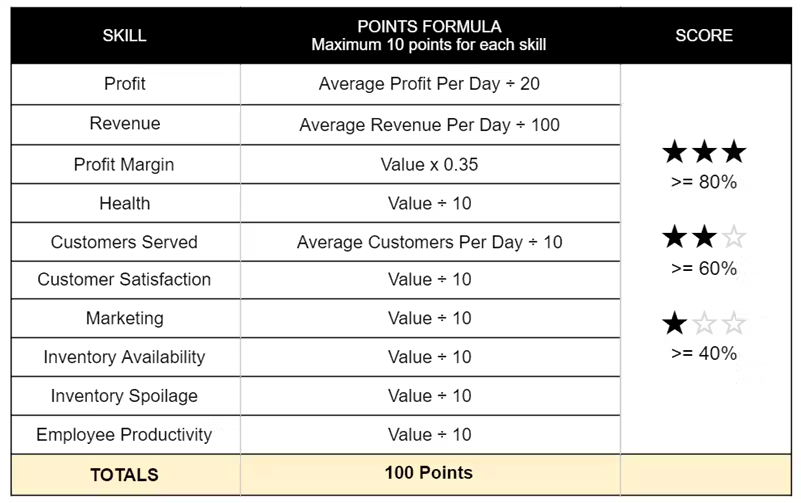
Profit Margin is Net Profit Margin.
Customers Served — To calculate points scored, the actual Average Customers Per Day value is adjusted based on the business type. This provides a consistent score for the various business types available.
Marketing is measured by the increase in customers achieved based on investments made in advertising and signage and appearance.
Employee Productivity is measured by the skills and reliability of each employees and weighted by the number of hours worked by each.
Inventory Availability is measured by the number of times a customer ordered a product and it was available — all inventory items were available to make the product.
Inventory Spoilage is measured by the value (cost of goods) of the items ordered and received as compared to the total value of all items ordered and received.
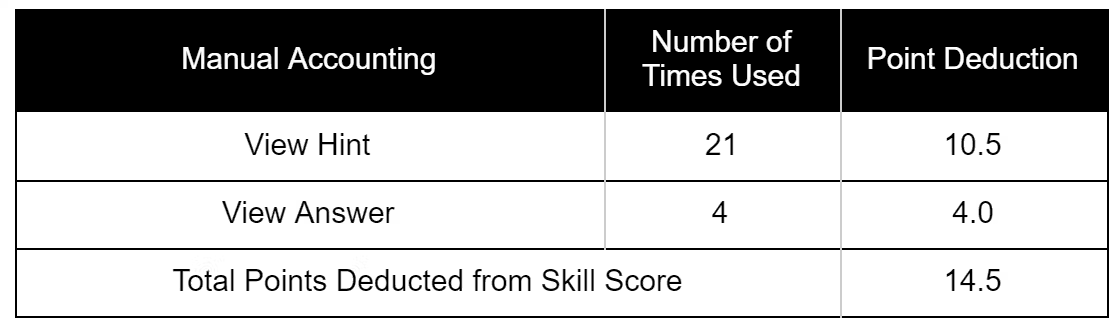
Kiosk With Manual AccountingIf the Kiosk business is played with Manual Accounting where students have to post their debits and credits for each financial transaction, points are deducted from the Skill score each time a student uses the options to Show Hint (minus 0.5 points) or Show Answer (minus 1.0 points).
Full Business
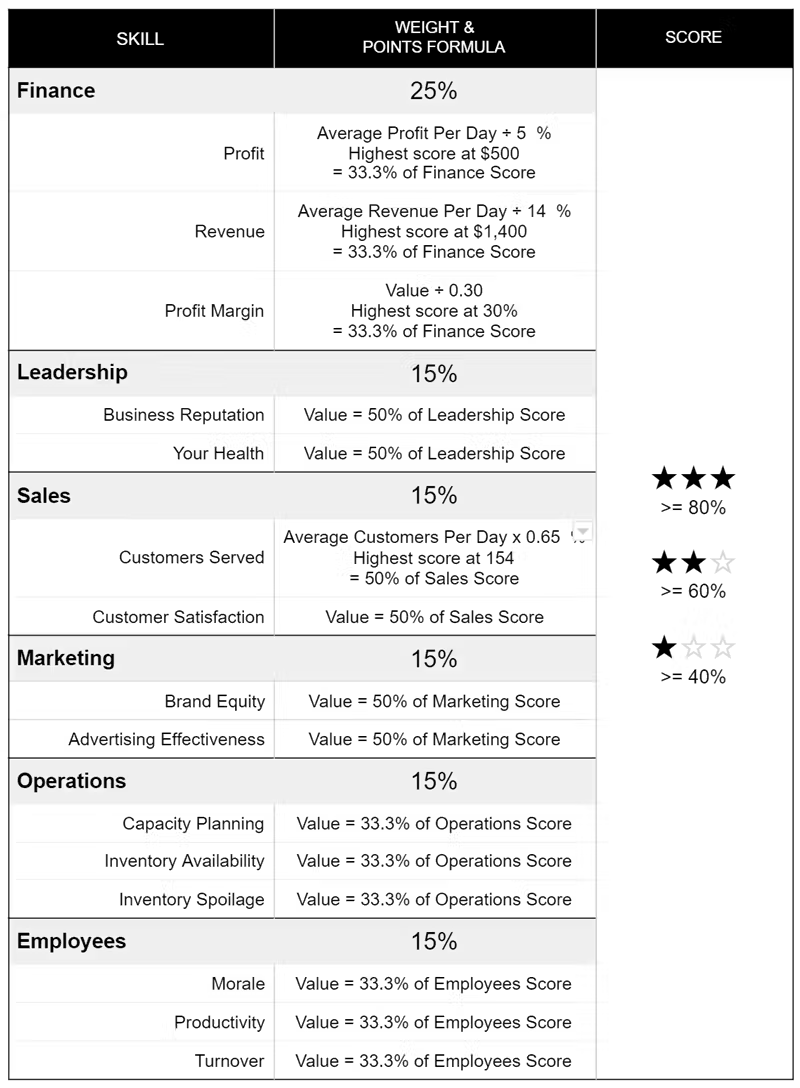
Profit is Net Profit.
Revenue is gross income.
Profit Margin is Net Profit Margin.
Business Reputation is comprised of Employee Morale, Paying bills on time, Social Responsibility, and Brand Awareness.
Health is based on the number of hours working and commuting versus home time.
Customers Served is the total number of customers who placed and received their order. To calculate points scored, the actual Average Customers Per Day value is adjusted based on the business type. This provides a consistent score for the various business types available.
Customer Satisfaction is based on speed of service, product quality, product price, and your/employee customer service skill.
Brand Equity is comprised of Brand Awareness and Business Reputation.
Advertising Effectiveness is comprised of Targeting Effectiveness, Messaging Effectiveness, and Media Effectiveness.
Capacity Planning is equal to the number of customers lost divided by the number of customers served and lost. Customers may be lost due to lack of space or efficiency of the site, lack of capacity of the equipment, or slow service due to too few people working.
Inventory Availability is measured by the number of times a customer ordered a product and it was available — all inventory items were available to make the product.
Inventory Spoilage is measured by the value (cost of goods) of the items ordered and served to customers as compared to the total value of all items ordered and received by the business.
Employee Morale is determined by salary, schedule, benefits, training, productivity, and customer satisfaction.
Employee Productivity is weighted by the number of hours worked by each employee.
Employee Turnover is equal to the number of employees who have left or have been let go, divided by the number of employees hired.
9.7 Team Evaluation
Have students confidentially assess their teammates after the simulation has ended.
If a simulation is run over several days or longer, consider conducting two assessments — one half-way through the simulation and the other at the end, as this provides students the opportunity to improve any deficiencies.
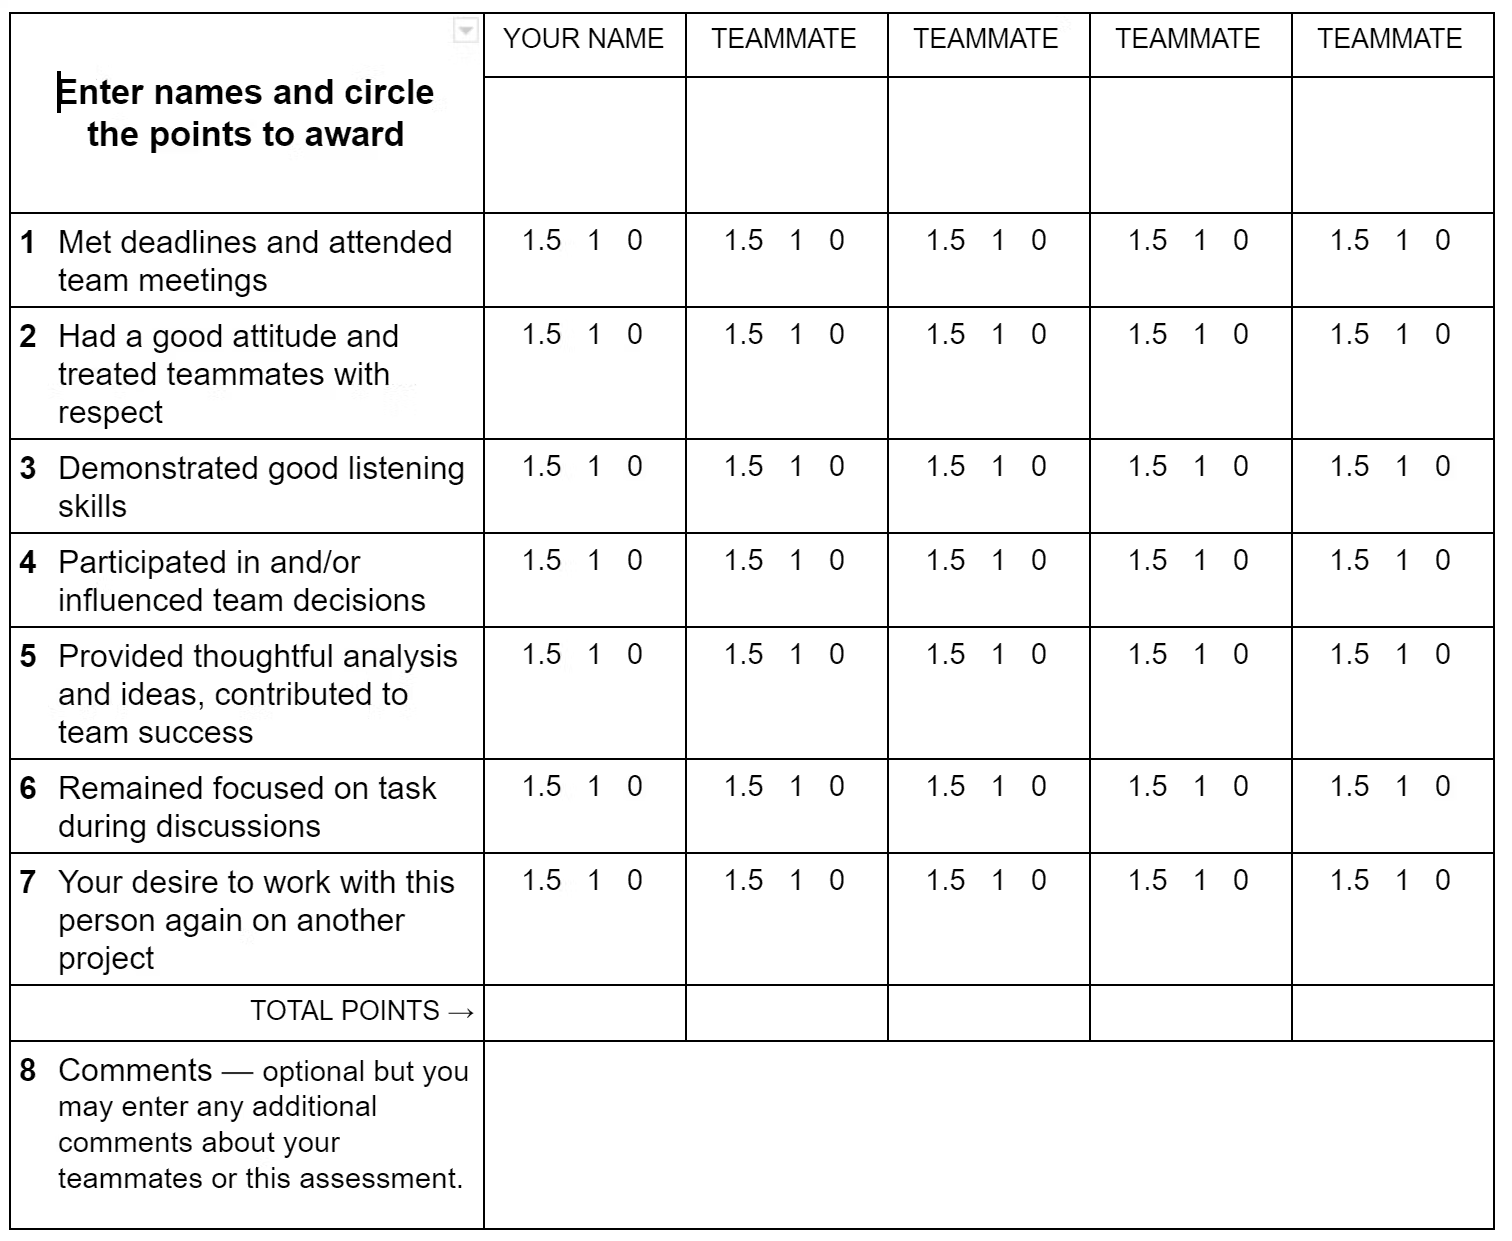
Below is a sample evaluation you can copy to create your own document.
📝 Team Evaluation
Copy the text and table below to provide to your participants. You may want to create a printable document. If you do not have the time or desire to collect or share sensitive feedback with participants, consider having them do the evaluation on themselves for self-reflection — this alone can be a useful exercise.
Directions
Evaluate YOURSELF and each of your TEAMMATES using the rating system shown below. Your teammates will be completing a similar evaluation. Your name and responses will be made available to your Simulation Manager (Instructor), who may or may not share this information with others.
| Rating | Points | Description |
|---|---|---|
| Great | 1.5 points | Your teammate was very good at this, perhaps one of the best on your team. |
| Good | 1 point | Your teammate was good at this and met the expectations of your team. |
| Not Good | 0 points | Your teammate did not meet the expectations of your team. |
| Unknown | 0 points | You did not interact enough with your teammate to know how to rate them, or this question does not apply to how your team worked together. |