10. Assessment & Monitoring
Playing a business simulation is one of the most memorable and meaningful educational experiences you can give to students. Complement this experience with an assessment and grading methodology that best aligns with your curriculum.
10.1 Monitoring
10.2 Viewing a Simulation as a Student
The Monitor Simulation feature can be used to view the simulation interface as a student. This mode is safe and has no effect on the simulation.
The View Settings feature can be used to review the detailed settings of a simulation.
An instructor can join and play the same simulation as students. But this is not normally recommended because it affects the market demand and results of the simulation, and students will see the instructor’s business.
An instructor can join and play a copy of the same simulation students are playing. Once a copy is created, the instructor can join the simulation to play. Note that this is a copy of the simulation settings but not the actual simulation students are playing — the copied simulation will not have any results or any other students in it. To create a copy, click the Create button then Copy and follow the prompts— be sure to turn on Computer-Run businesses.
10.3 How to Copy Data Tables to a Spreadsheet
The Rubric Report and some financial statements include a CSV Export option. All other report data can be copied from GoVenture and pasted into a spreadsheet — watch the video below for directions.
10.4 Access for Teaching Assistants
Teaching Assistants (TAs) can be given access to an instructor’s simulation to help with student guidance and assessment.
Expand this section — click the black triangle
There are three ways to work with a TA:
- You can share your login info (username/password) — this gives the TA full access as if they are you.
- The TA can be set up with their own instructor account using their own login. You can then use the SHARE REPORTS feature on your instructor dashboard (in the Actions Tile) to give them VIEW access to all of your simulation reports. The TA does not have any access to your account, they can only view all of the simulation reports.
- The TA can be set up with a student account. This allows them to play the simulation as a student just like the other students. This also means they will affect the market, which could be problematic.
Contact us to request access for your TA — there is no cost.
10.5 Assessment Methods | Summary
Choose one or a combination of the options in the table below that best match your preferences. Consider creating a rubric that assigns a percentage to each assessment method. The options are listed in no particular order and are detailed further in this document matching the blue numbers.
10.5.1 Simulation Participation and Performance
| METHOD | PROS | CONS |
|---|---|---|
| 1️⃣ Participation recommended |
Maximum fairness with results completely in student control. Fully automated. | Does not require, measure, or validate level of effort or thoughtful decision making. |
| 2️⃣ Performance Metric |
More competitive and performance-based (although not fully validated). Fully automated. | A single metric is not a holistic or reliable measure of skill or effort. Some students could make a good effort and still not score high. |
| 3️⃣ Rubric Score recommended |
Provides a more holistic measurement of skill and effort. Fully automated. | No significant cons. Some metrics may not align with a student’s strategy. |
10.5.2 Written Reports & Presentations
| METHOD | PROS | CONS |
|---|---|---|
| 4️⃣ Strategy Journal recommended |
Likely to improve decision-making and thoughtfulness by requiring students to articulate their strategies. | Assessment requires instructor or TA to review text-based journal, which takes time and can be more subjective. |
| 5️⃣ Student Experience Report or Presentation |
Encourages students to reflect on their simulation experience and what they learned, and then organize and present their thoughts. | Assessment requires instructor or TA to review report, which can be more subjective and time-consuming. |
10.5.3 Tests
| METHOD | PROS | CONS |
|---|---|---|
| 6️⃣ Team Evaluation |
Allows teammates to measure individual contributions. Fully automated. Can be repeated. | Requires review and assessment by instructor or TA. Results can be subjective. Only used with teams, not individual play. |
| 7️⃣ Competency Quiz recommended if time |
Ideal complement to simulation experience. Enhances learning and helps students identify knowledge deficiencies. Fully automated. | Requires 45 minutes to 2 hours to complete in class or as homework. |
10.5.4 Book and Other Activities
| METHOD | DESCRIPTION |
|---|---|
| 8️⃣ Learning & Activity Book |
Easy to read with many examples to make fundamental business concepts easy to understand. |
| 9️⃣ Ethics Report |
A useful activity for helping students gain insight into ethical decision making. Requires manual review and grading by the instructor or TA, which takes time. |
| 🔟 Financial Statements Activity |
A spreadsheet-based activity that requires a student to build a Balance Sheet and Profit & Loss Statement using the General Ledger of the business played in the GoVenture CEO simulation. |
| 1️⃣1️⃣ Ratio Analysis Activity |
A spreadsheet-based activity that requires a student to build a Balance Sheet and Profit & Loss Statement using numbers from the business played in the GoVenture CEO simulation. The student must then use those numbers to complete a number of financial ratios. |
| 1️⃣2️⃣ Accounting |
A number of accounting features are available in GoVenture CEO that enable instructors to create their own activities for students. |
10.6 Assessment Methods | Details
1️⃣ Participation
Expand this section — click the black triangle
Participation means making and saving decisions for each period of the simulation.
| PROS | CONS |
|---|---|
| Maximum fairness with results completely in student control. Fully automated. | Does not require, measure, or validate level of effort or thoughtful decision making. Students may not be as motivated to achieve high performance-based results (although there is always some level of social motivation inherent in a multiplayer competition). |
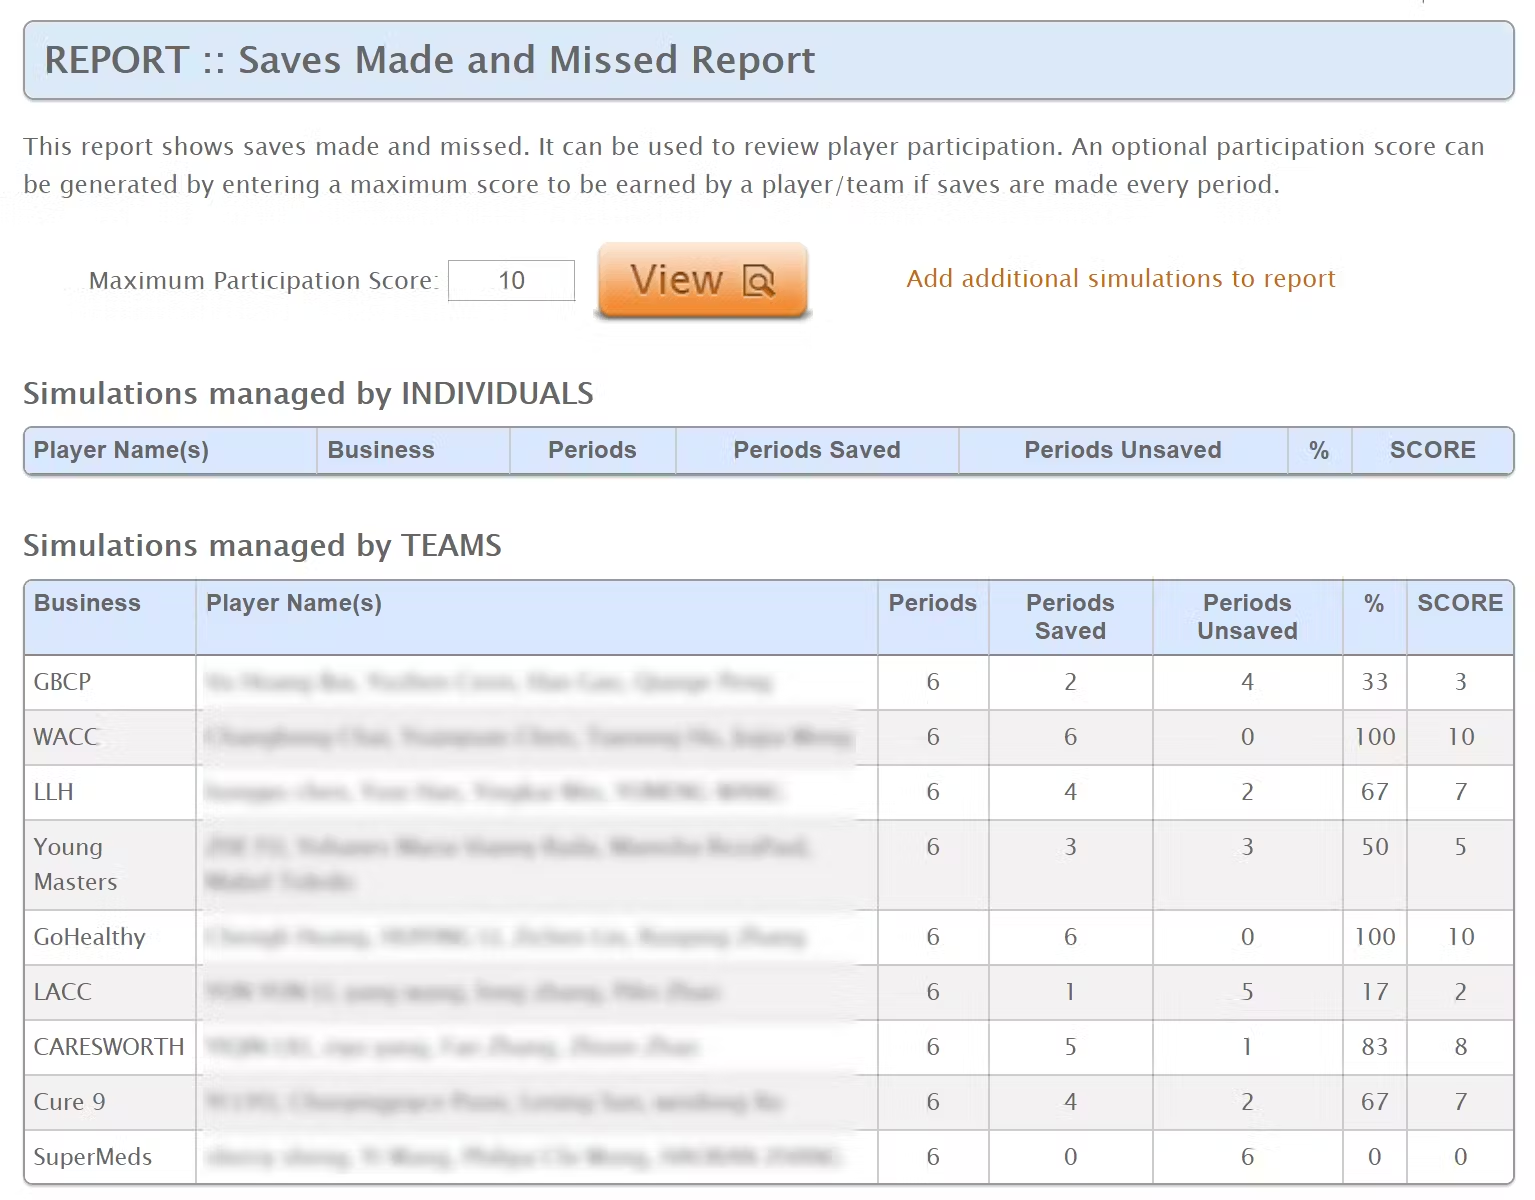
For example, if a simulation is set to advance 10 periods, but a student only saves decisions for 7 periods, the Participation Score would be 70%. Implementation
Participation-based grading is ideal for practice simulations. It can also be used as a partial grade for non-practice simulations. There are two ways that participation-based grading can be implemented:
- Require students to save decisions every period. Missing a period results in a lower grade. This is the best approach when scheduling is not an issue and students will have plenty of time to make their decisions.
- Require students to save decisions a minimum number of periods. This is useful if students may not have time to make decisions every period. For example, if a simulation is advanced every day for 6 consecutive days, you may only require a student to save decisions on at least 4 of the 6 days in order to get full marks. This provides students the flexibility to fit the simulation around their schedules. Some students may play only 4 periods while others may play all 6.
With a graded simulation, consider setting a percentage of the grade on participation. For example, 40% of the grade is solely based on saving decisions in all periods of the simulation. This assures students of a strong base grade that is entirely within their control simply by putting some effort into the activity.
The SAVES MADE & MISSED REPORT automatically tracks the number of periods in which students saved their decisions and you can generate a score automatically, as shown below. Find this report under VIEW ALL REPORTS. Saves Made is also includd in the RUBRIC REPORT.
Tutorial Quiz
Simulations can include a Tutorial Quiz which prompts students to answer 13 questions about how to use the simulation. Answers are easily found as the purpose of this quiz is to encourage students to view the Tutorial Video and User Guide before playing the simulation. Instructors may choose to include the results of the Tutorial Quiz in student grades. Results are visible in the STATUS REPORT and RUBRIC REPORT. Only include the Tutorial Quiz with the first simulation.
2️⃣ Performance Metric
Expand this section — click the black triangle
Scores are provided for all key business metrics in the simulation, such as Net Profit or Share Price.
- A single overall score is provided for each student based on a scoring metric selected by the instructor, and students are ranked according to this metric.
- Scoring metric options include Net Profit, Share Price, Revenue, Units Sold, Market Share, Brand Equity, Advertising Effectiveness, Brand Equity, Human Resources, and Employee Morale.
- Net Profit or Share Price are the recommended scoring metrics. Other metrics should only be used if a simulation is being used for a specific instructional purpose.
| PROS | CONS |
|---|---|
| More competitive and performance based (although not fully validated). Fully automated. | A single metric is not a holistic or reliable measure of skill or effort. Some students could make a good effort and still score low (some could even score 0%). |
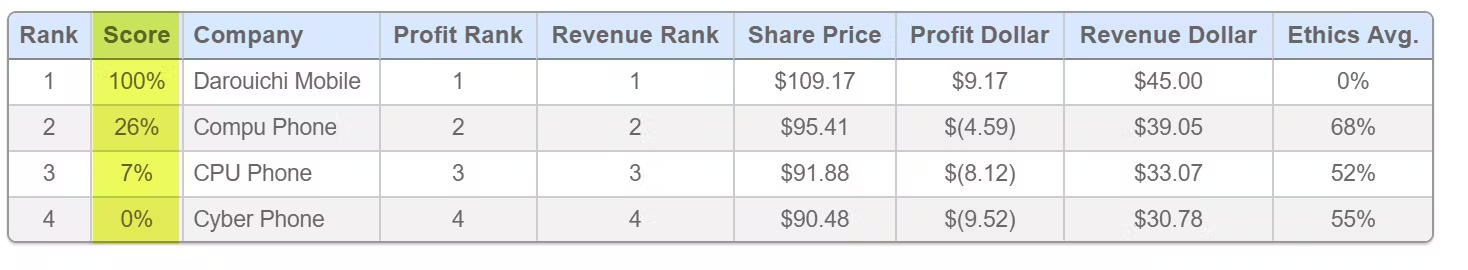
The above metrics are scored on a scale from 0 to 100% where the business with the highest value is assigned 100% and all other business scores are normalized accordingly. For example, a business with $10 profit is assigned a score of 100% and a business with $3 profit is assigned 30%. Each score is updated every period, based on cumulative results for the entire duration of the simulation.
Implementation
The score described above should not be directly used as a grade, because it is possible for unprofitable businesses to receive a score of 0%, even though they may be applying a reasonable amount of effort. Instead, the grade should be based on a percentile comparison or other level-based method. For example, a maximum grade of 5 points for performance could be based upon the following levels:
- Top 10% earns 5 points
- Top 25% earns 4 points
- Top 50% earns 3 points
- Top 75% earns 2 points
- Top 90% earns 1 points
The metrics are visible in a number of reports, including the Status Report, Performance DEBRIEF Report, and Coaching Report.
3️⃣ Rubric Score
Expand this section — click the black triangle
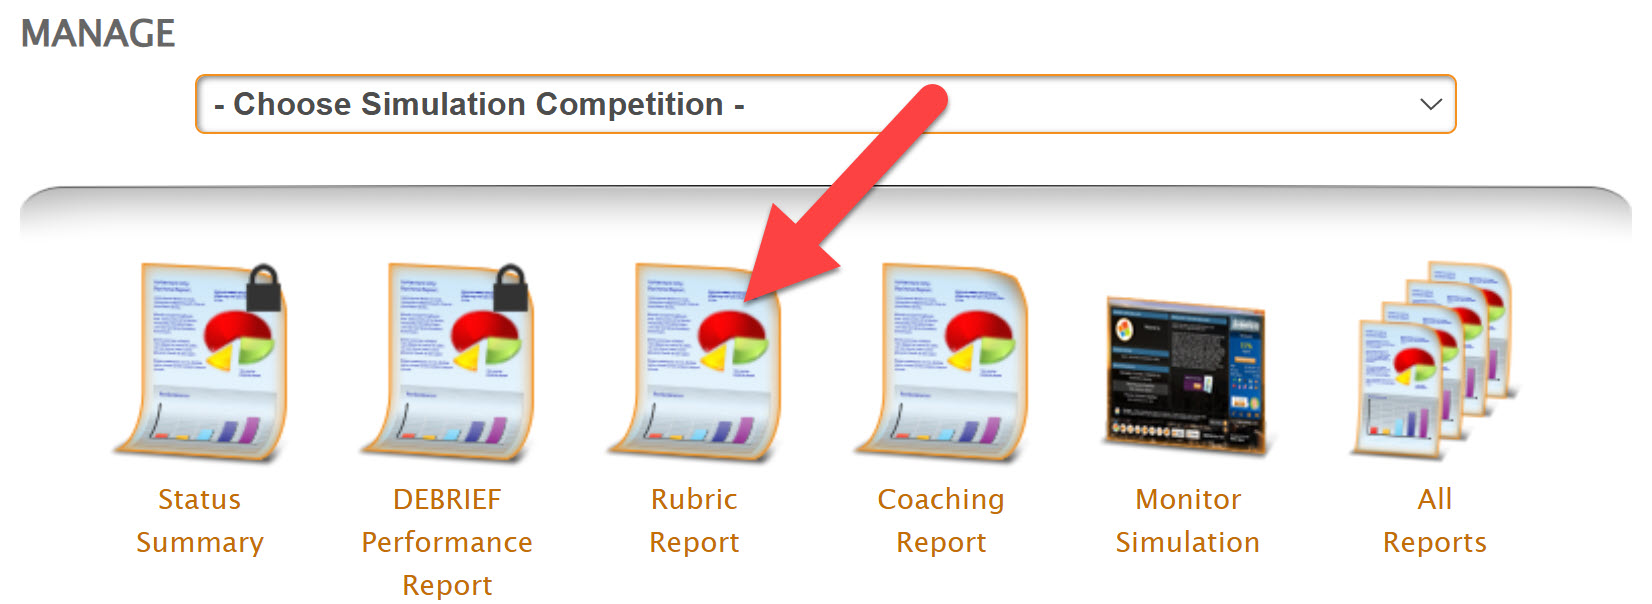
The instructor (Simulation Manager) has access to a Rubric Report. The Rubric Report scores student performance on multiple business metrics demonstrated and evaluated in the simulation.
| PROS | CONS |
|---|---|
| Provides a more holistic measurement of skill and effort (unlike other reports which provide detailed metrics and scores of specific business activity and results). Fully automated. | No significant cons. Some metrics may not align with a student’s strategy. |
The Rubric Report enables you to generate a balanced score for each business based on a combination of metrics. You may choose a percentage for each metric for a total of 100%.
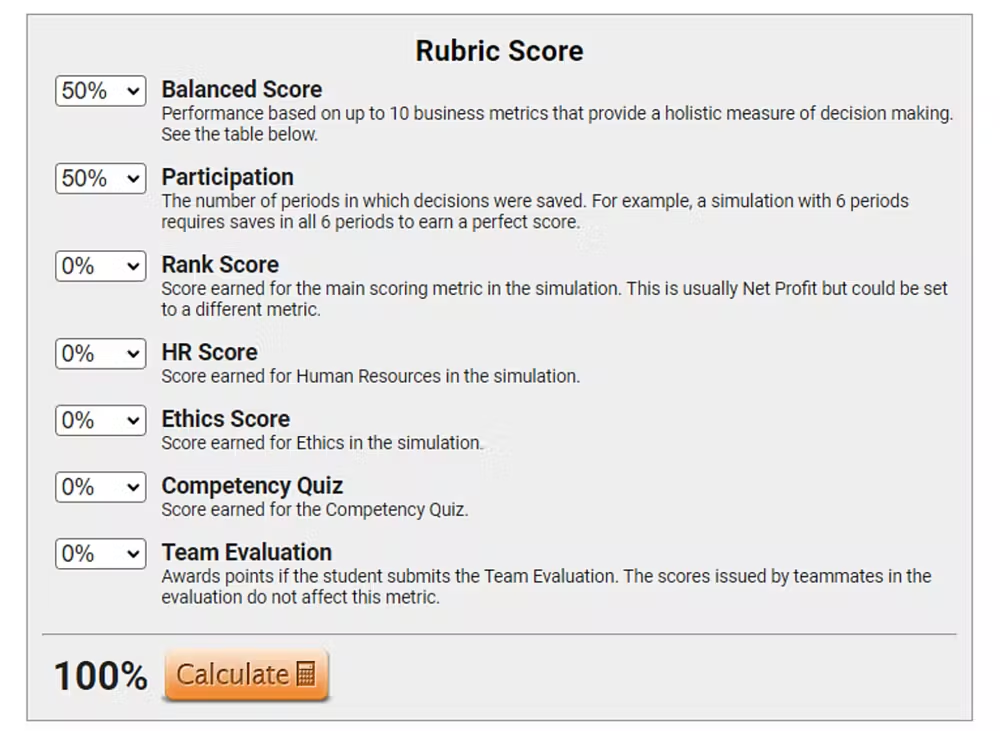
For more details, view the Rubric Report on your Instructor Dashboard.
Implementation
- The Rubric Report is automatically generated and can be viewed by the instructor at any time. Students can view their own Rubric Reports (but not the data for other students) from within the Performance Report.
- Instructors may also choose to create a custom grading formula by copying GoVenture reports and pasting them into Excel or other spreadsheet.
4️⃣ Strategy Journal
Expand this section — click the black triangle
GoVenture CEO includes a Strategy Journal where students can identify their strategies. The Strategy Journal includes a JOURNAL feature and a NOTES feature.
| PROS | CONS |
|---|---|
| Likely to improve decision-making and thoughtfulness by requiring students to articulate their strategies. | Assessment requires instructor or TA to review text-based journal, which takes time and can be more subjective. |
The JOURNAL feature (shown below) presents students with a series of options to choose from. This provides a simple and structured way to help direct students to think strategically.

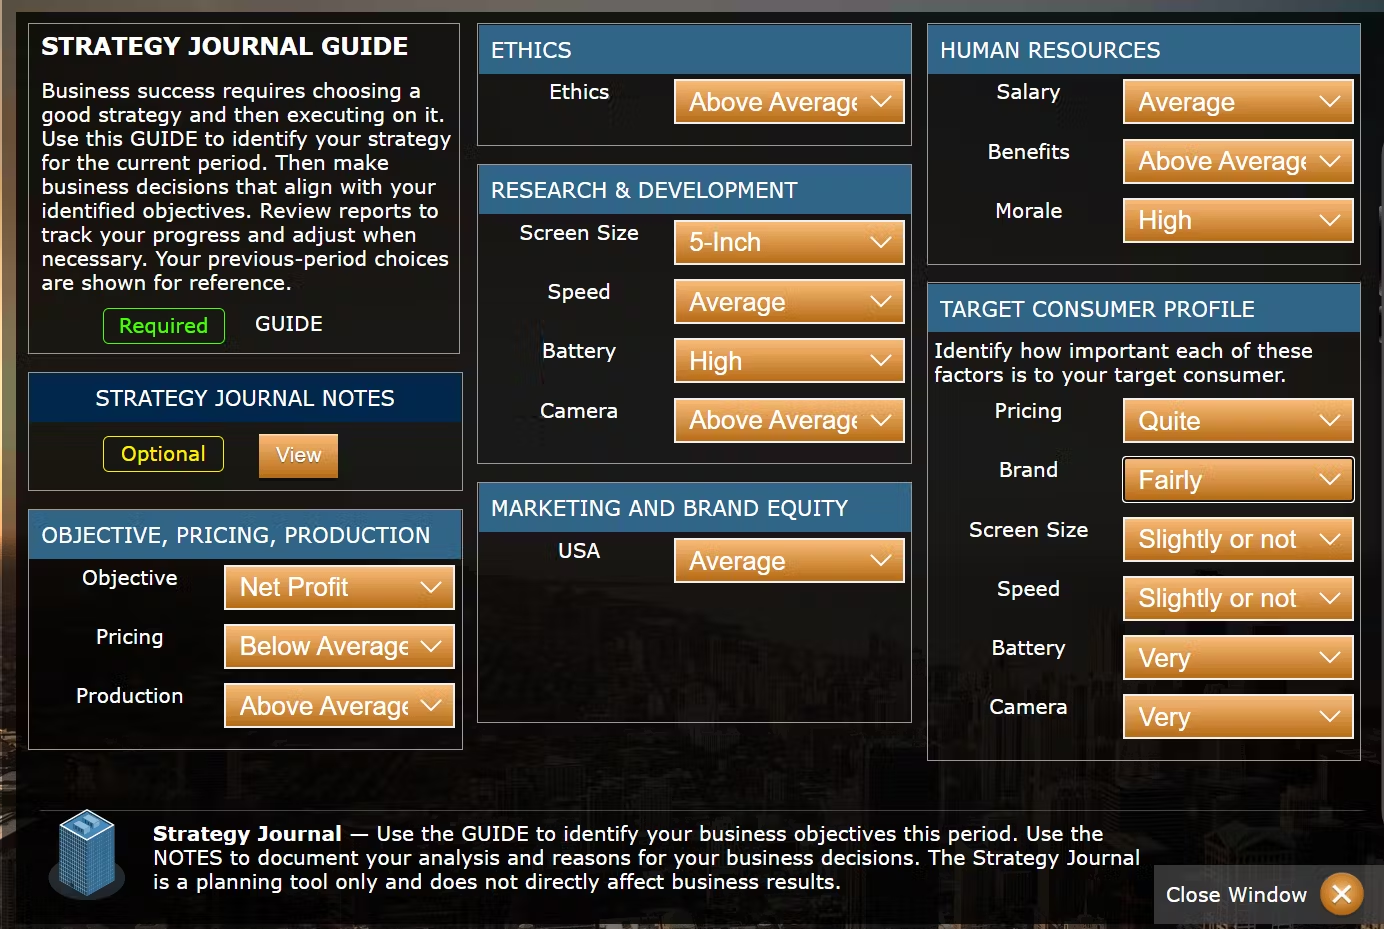
For example, if selling automobiles, does the student want to sell automobiles with average features at a low price, or does the student want to sell luxury automobiles at a high price? The JOURNAL helps students identify their intended strategy.
The JOURNAL does not affect the results of the simulation. The JOURNAL records student intent so that intent can be compared with actual results. Adjustments can then be made to more closely align with an intended strategy, or the strategy can be adjusted. The JOURNAL can be can be set to be optional or required — required is recommended.
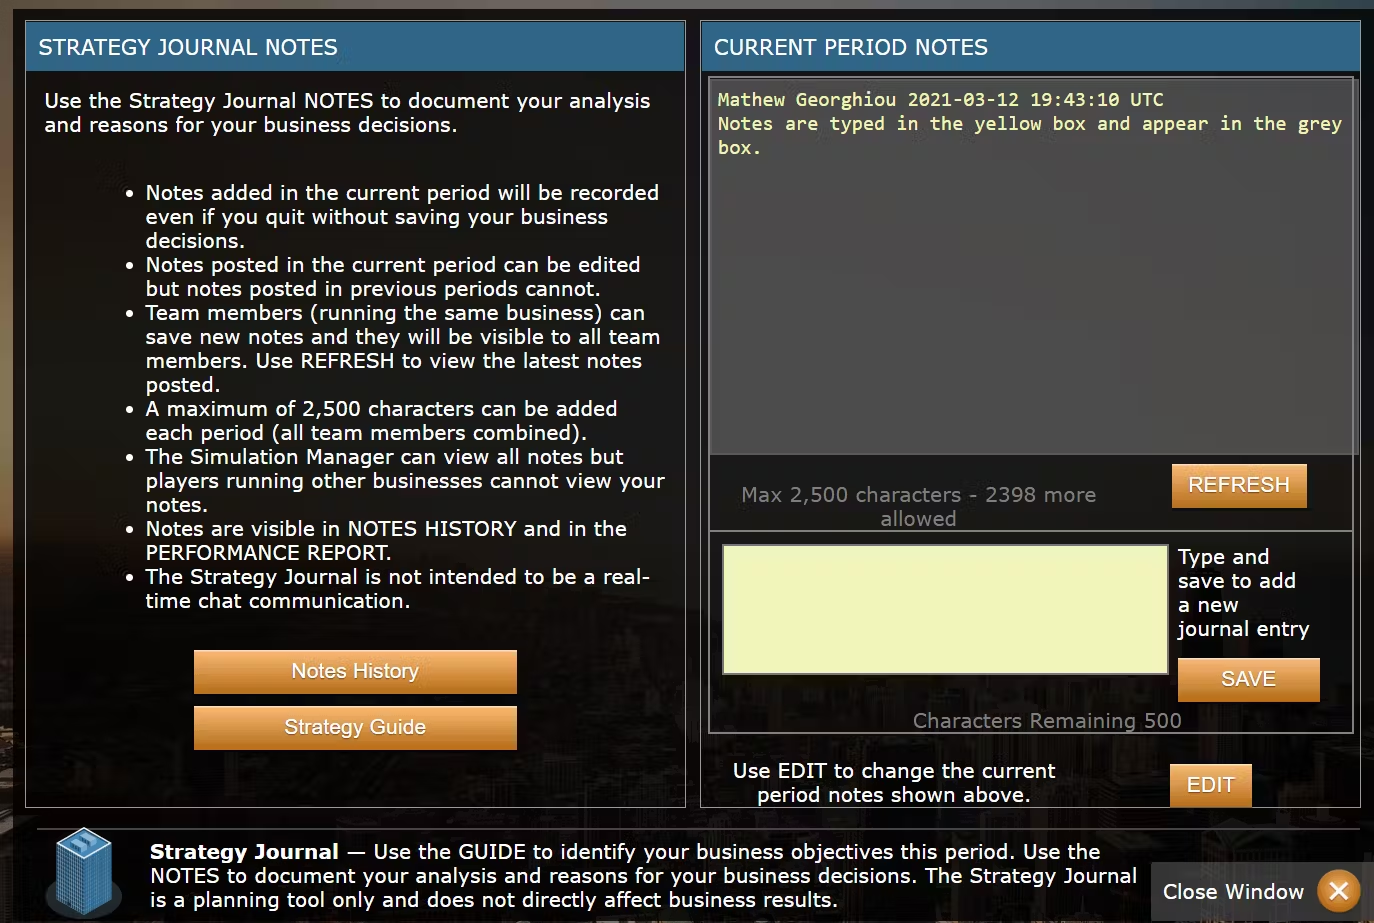
The Strategy Journal NOTES feature enables students to blog about their decisions as they play each period of the simulation. This provides a useful historical record of student thinking and can form part of an assessment. Past entries cannot be edited. NOTES can be can be set to be optional or required.
A maximum of 2,500 characters (approx 400 words) can be entered in the Journal for each period of a particular business. To view student Strategy Journals, in the Manage tile choose ALL REPORTS > Performance Reports and scroll down to the very bottom of the report.
Implementation
- The Strategy Journal is built into GoVenture CEO and students can access it under the MANAGEMENT screen when playing.
- Instructors can make the JOURNAL and/or NOTES features optional or required by setting this option when the simulation is being created. Instructors should also inform students of their expectations.
- When a feature is set to required, students are unable to SAVE their decisions in the period unless and until they complete the Strategy Journal. A warning message is displayed to prompt them to complete the Strategy Journal.
- When the NOTES feature is set to required, the simulation can only detect if text has been typed into the NOTES field. The text is not analysed in any way for quality or minimum quantity.
- Instructors can view student Strategy Journals using ALL REPORTS > Performance Reports (scroll to very bottom of report)
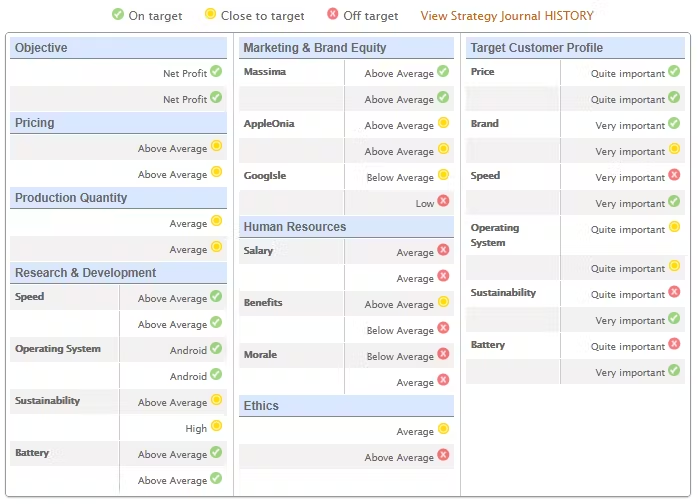
- Instructors and students can view the COACHING REPORT to assess how aligned business results are to the strategy identified in the Strategy Journal.
- A chart shows if each strategic item is On Target, Close to Target, or Off Target.
5️⃣ Student Experience Report
Expand this section — click the black triangle
- Instructors may choose to have students prepare written, live, or video presentations or reports on their experience playing the simulation.
- A Student Experience Report template is available for instructors to customize and provide to students.
- 21 questions are included (samples shown below) which can be downloaded, edited, and sent to students (using your school LMS or other method).
- Consider including limits on the length of each answer or the entire report.
- Templates are available for written report and slides.
- These links are for instructors— do NOT share these links with your students:
6️⃣ Team Evaluation
Expand this section — click the black triangle
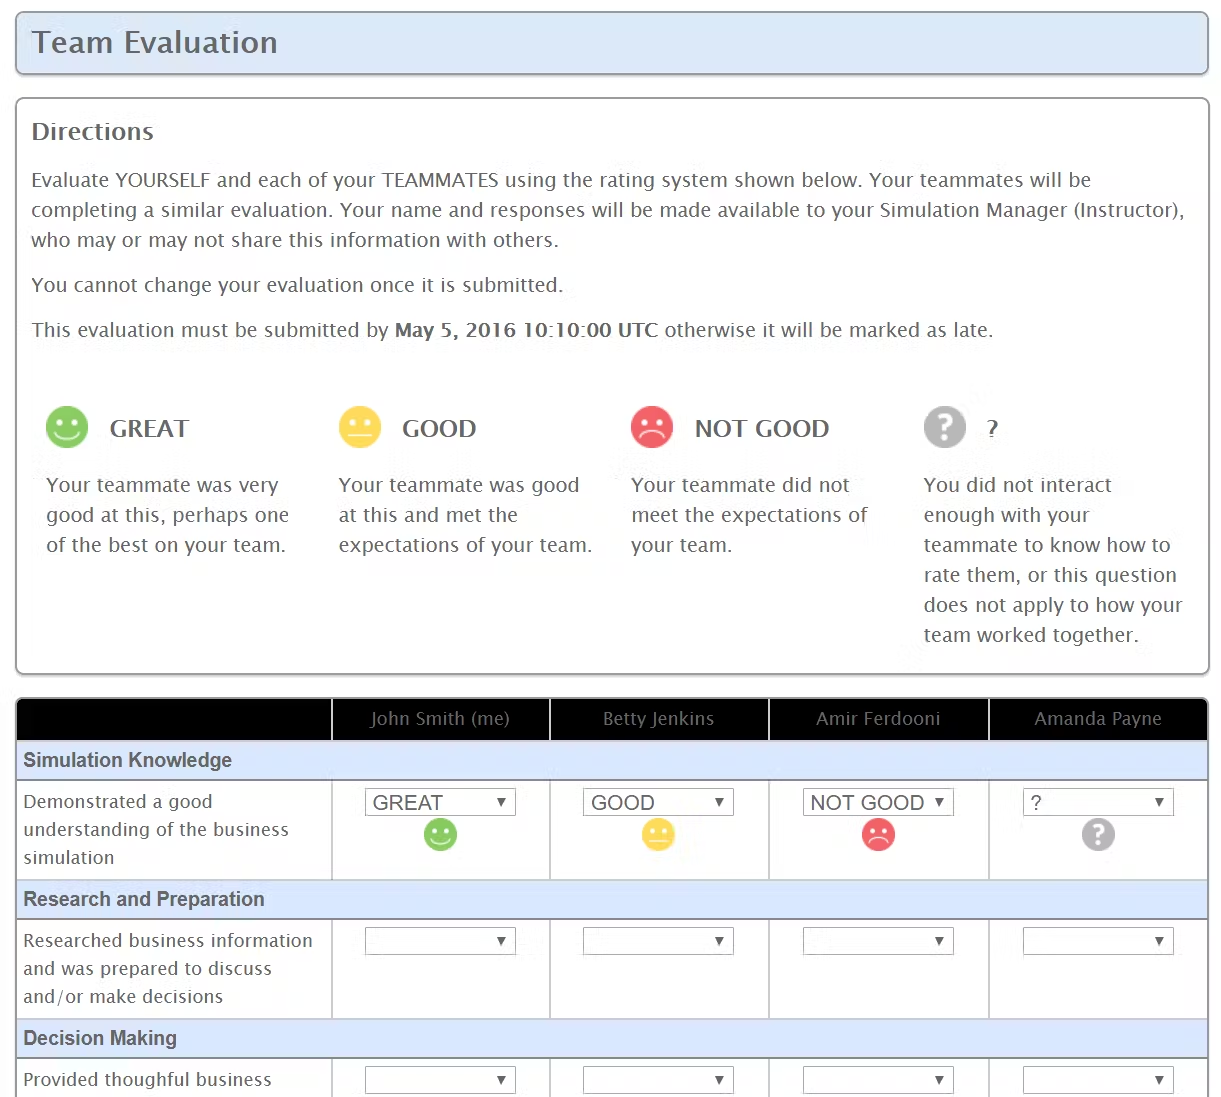
- If students are playing a simulation in teams, you can have them submit peer evaluations of their teammates' performance using the Team Evaluation. This may be useful for identifying strong and weak contributors for grading or other purposes. Students do not see each other’s evaluations.
- Instructors may want to consider having students complete the Team Evaluation multiple times so that underperforming students can be made aware of their deficiencies with sufficient time to improve.
- Instructors must turn this feature on to use it — in the Manage tile, choose Performance Quizzes
- The Team Evaluation provides a points system an alternative scoring method with 1.5 points for Great, 1.0 points for Good, and 0 points for Not Good or Don't Know.
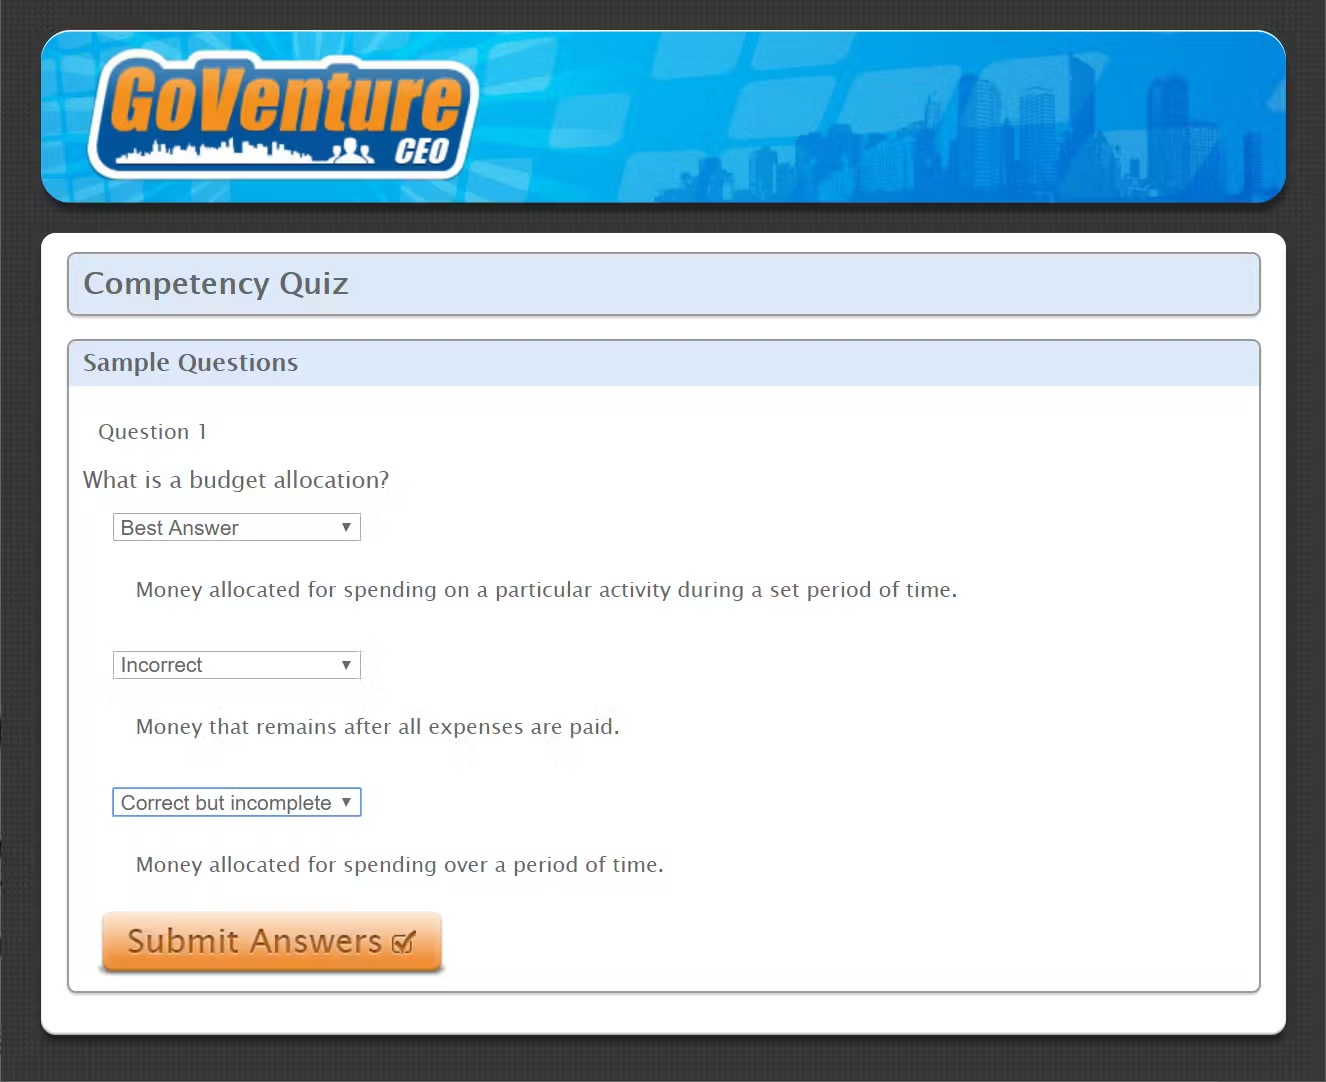
7️⃣ Competency Quiz
Expand this section — click the black triangle
- The Competency Quiz is a multiple-choice test created by the GoVenture CEO system. The Competency Quiz is personalized for each student. Students must gather answers from their actual simulation results, in addition to answering questions on business theory. The Competency Quiz can be required for each unique simulation that is played, but can only be taken by students once the simulation has ended.
- Instructors may want to consider including the Competency Quiz after a practice simulation to help students discover early on where they may need improvement. If used for such purpose, a small participation (not performance) grade should be awarded for completing the Quiz.
- Time Required— The time varies based on the number of question modules enabled. See the type and number of questions in the table below. On average, 1 minute per question should be allocated for completion.
- Global Statistics are available to allow instructors to compare their student performance to other students around the world.
- Instructors must turn this feature on to use it — on the Instructor Dashboard in the Quizzes tile, choose Manage Quizzes.
Competency Quiz Questions 1
| Module | Business Theory Questions | Simulation Questions |
|---|---|---|
| Budgeting, Revenue, Profit | 5 | 2 |
| Pricing | 6 | 1 |
| Reseller Discount | 3 | 1 |
| Research & Development | 2 | 1 |
| Production & Inventory | 6 | 3 |
| Product Expiration | 1 | 1 |
| Carrying Costs | 1 | 1 |
| Sales & Marketing | 8 | 3 |
| Multiple Territories | 1 | 0 |
| Advertising | 3 | 1 |
| Human Resources | 12 | 1 |
| Financial Statements | 0 | 1 |
| Balance Sheet | 2 | 0 |
| Profit & Loss | 2 | 0 |
| Cash Flow | 2 | 0 |
| Stock | 6 | 1 |
| Loans | 5 | 1 |
| Ethics | 1 | 1 |
| Business Strategy | ||
| Business Strategy | 4 | 1 |
8️⃣ Business Superhero Book
Expand this section — click the black triangle
 Business Superhero Book is a 240-page PDF that covers 145 topics in a format that is easy to read with large text and many examples to make fundamental business concepts easy to understand. Students can use the book as a reference for topics they need help with, or read it from cover to cover to gain practical business wisdom. The book includes fill-in-the-blank tables that students can complete for practice or submit for assessment. The book is available on the Instructor and Student Dashboards.
9️⃣ Ethics Report
Expand this section — click the black triangle
Students prepare written, live, or video presentations or reports on their ethics strategy while playing the Simulation. An Ethics Report template is available for instructors to customize and provide to students. 5 questions are included which can be downloaded, edited, and sent to students. Consider including limits on the length of each answer or the entire report.
Click the link above then click FILE > Download
then edit (if desired) and distribute to students
To assign this activity, follow these steps:
- Identify the specific Simulation Number for the student to use.
- Identify the Due Date for the activity to be completed.
- Give students directions on how to submit the completed report file back to you.
- Download the document and make it available to students.
- It may be best to assign the activity before the simulation ends so that students can check how Ethics affects Operating Costs in the simulation.
- The activity will take students up to 1 hour to complete.
🔟 Financial Statements Activity
Expand this section — click the black triangle
An Excel spreadsheet is available for instructors to assign to students as a supplemental learning activity. The spreadsheet requires a student to build a Balance Sheet and Profit & Loss Statement using the General Ledger or Trial Balance of the business played in the GoVenture CEO simulation. Once completed, the student can save and submit the Excel spreadsheet to the instructor to validate completion of the activity. The activity takes about 1 hour of time to complete and it can be assigned multiple times.
Click the link above then click FILE > Download
then edit (if desired) and distribute to students
To assign this activity, follow these steps:
- Identify the specific Simulation Number for students to use. Use a simulation with the Balance Sheet and Profit & Loss Statement turned OFF (hidden) — this is a setting that can be set when creating or editing a simulation (instructors can use EDIT SETTINGS to show or hide the report at any time).
- Identify the specific Periods in the simulation to use — the spreadsheet can accommodate up to 6 periods.
- Identify the Due Date for the activity to be completed.
- Give students directions on how to submit the completed Excel file back to you.
- Download the Excel file and make it available to students.
- This is a personally-customized learning activity because it requires students to use financial numbers from their own businesses. Each student will have different numbers.
- Instructors may choose to grade the activity by validating the numbers manually by comparing them to the financial statements found in GoVenture CEO > All Reports > Performance Reports (scroll down the report to view the financial statements). Note that the financial statements have to be set to be ON (visible) using EDIT SETTINGS of the simulation. otherwise they will not appear in the Performance Report. Note also that the Profit & Loss Statement may be offset by a Rounding Adjustment value shown in the statement.
- The Excel spreadsheet is protected so that students can only input the required numbers.
1️⃣1️⃣ Ratio Analysis Activity
Expand this section — click the black triangle
An Excel spreadsheet is available for instructors to assign to students as a supplemental learning activity. The spreadsheet requires a student to build a Balance Sheet and Profit & Loss Statement using numbers from the business played in the GoVenture CEO simulation. The student must then use those numbers to complete a number of financial ratios.
The spreadsheet is programmed to immediately identify correct and incorrect answers and the student can make unlimited attempts to answer correctly. Once completed, the student can save and submit the Excel spreadsheet to the instructor to validate completion of the activity. The activity takes about 1 hour of time to complete and it can be assigned multiple times.
Click the link above then click FILE > Download
then edit (if desired) and distribute to students
To assign this activity, follow these steps:
- Identify the specific Simulation Number for students to use.
- Identify the specific Periods in the simulation to use — the spreadsheet can accommodate up to 6 periods.
- Identify the Due Date for the activity to be completed.
- Give students directions on how to submit the completed Excel file back to you.
- Download the Excel file and make it available to students.
- This is a personally-customized learning activity because it requires students to use financial numbers from their own businesses. Each student will have different numbers and the spreadsheet is programmed to identify correct answers for the ratios. But, note that the spreadsheet does not validate the numbers used to build the Balance Sheet and Profit & Loss Statement. While not necessary, Instructors may choose to validate these numbers manually by comparing them to the financial statements found in GoVenture CEO > All Reports > Performance Reports (scroll down the report to view the financial statements).
- Instructors can grade students based on the number of correct answers submitted. The Instructions & Results worksheet makes it easy for instructors to view this information at a glance. This method of grading takes less than one minute per student.
- The Excel spreadsheet is protected so that students can only input the required numbers and so students cannot see the formulas for the correct answers. However, protecting an Excel spreadsheet is not foolproof and students can find tools to overcome this security.
- It is advisable that students use Microsoft Excel to open the spreadsheet, as using another application may cause unpredictable behavior with the built-in formulas and settings..
- There are three sets of ratios, with one set being Shareholder ratios. To complete these ratios, students must have played a simulation with the STOCKS feature turned on.
1️⃣2️⃣ Accounting Features
Expand this section — click the black triangle
Instructors who are focused on accounting may want to consider using the following features in GoVenture CEO.
Gameplay
-
Accounting Decisions
This simulation offers a high-level strategy experience that is focused on budget management and the analysis of market and financial data. Students must manage costing, budgeting, working capital, cash flow, financial statements, and more. Students also compete against each other in the same marketplace to win the same customers.
Accounting Videos
More than 35 accounting videos are available for students to learn accounting terminology and principles. Instructors can direct students to MediaSparkApps.com/accounting.
Financial Reports
GoVenture CEO includes all common financial statements and reports used in business. These reports can be used as a context for assigning a variety of accounting and finance activities. Reports in the simulation can also be hidden so that students have to build their own reports from other data. Financial reports include: Balance Sheet, Profit & Loss, Cash Flow, Inventory, General Ledger, General Journal.
-
See Financial Statements Activity and Ratio Analysis Activity described above.
Financial Line Items
-
Income Tax
Instructors can set a specific Income Tax rate to be applied in the simulation. Income Tax is the percentage of Profit payable to the government. It is deducted from Cash as an expense each period based on the Profit earned in the period. Income Tax paid does not affect the amount of Budget available or how it is calculated (if based on a percentage of Revenue).
Payroll Tax
Instructors can set a specific Payroll Tax rate to be applied in the simulation. Payroll Tax is a percentage of Salary payable to the government. For simplicity, it is included in the Salary expense that is shown in the HR module of the simulation (and set by the instructor). Payroll Tax is displayed as a separate line item in the Profit & Loss Statement, General Journal, and General Ledger. For example, if Salary is 2,000 and Payroll Tax is 10%, the 2,000 Salary includes $181 in Payroll Tax (both the employee and employer portions).
Depreciation & Amortization
Instructors can set a specific rate to be applied in the simulation. Depreciation & Amortization is the reduction in value over time of tangible and intangible assets. It appears each period as an expense on the Profit & Loss Statement and reduces the value of Property, Plant, and Equipment on the Balance Sheet.
HR Costs Related to Production are Posted as COGS
There are 5 HR categories of employees in GoVenture CEO: Production, Operations, R&D, Sales & Marketing, and Management. The Production employees are posted under Cost of Goods Sold.
Instructors can change revenue to accrual-basis accounting instead of cash-basis accounting. This change includes two features:
-
Cash and Accounts Receivable
Instructors can identify the percentage of REVENUE to be deposited in CASH (paid) in each period and the percentage to be posted to ACCOUNTS RECEIVABLE (A/R unpaid). Must add up to 100% each period. Five periods can be set and for simulations that are longer than five periods, the settings will be repeated in order: 1, 2, 3, 4, 5, 1, 2, 3, 4, 5 etc. Note that players do not see these values until they are encountered. Example settings are shown below.
| PERIOD | 1 | 2 | 3 | 4 | 5 |
|---|---|---|---|---|---|
| CASH | 70% | 60% | 85% | 80% | 50% |
| A/R | 30% | 40% | 15% | 20% | 50% |
| Total | 100% | 100% | 100% | 100% | 100% |
Instructors can identify the percentage of ACCOUNTS RECEIVABLE (A/R) that is deposited (paid) to CASH after the period in which it is earned. An A/R can be aged to a maximum of 3 periods after the period in which it is earned.
Percentages added under BAD DEBT (BD) will never be paid, and after 3 periods will be moved from an A/R asset on the Balance Sheet to a Bad Debt expense on the Profit & Loss Statement. For simulations that are longer than five periods, the settings will be repeated in order: 1, 2, 3, 4, 5, 1, 2, 3, 4, 5, etc. Note that players do not see these values until they are encountered.
| REVENUE | 1 PERIOD AGED | 2 PERIODS AGED | 3 PERIODS AGED | BAD DEBT | TOTAL |
|---|---|---|---|---|---|
| PERIOD 1 | 70% | 20% | 5% | 5% | 100% |
| PERIOD 2 | 60% | 25% | 5% | 10% | 100% |
| PERIOD 3 | 80% | 10% | 10% | 0% | 100% |
| PERIOD 4 | 70% | 10% | 8% | 12% | 100% |
| PERIOD 5 | 80% | 10% | 5% | 5% | 100% |
In the first table, Period 1, 30% of the Revenue is posted to Accounts Receivable. In the second table, Period 1, this 30% Revenue is aged as follows: 70% of it will be received in the next period, 20% in the period after that, then 5% in the period after that, and 5% will be posted as Bad Debt.
10.7 Grading
To convert the GoVenture assessment into a course grade, compare the estimated hours required for each GoVenture activity to the total number of course hours, including homework. Then assign a grade percentage that reflects this proportion.
- For example, if your course requires 60 total hours and one GoVenture CEO simulation takes 5 hours, you might assign it at least 8% of the total course grade.
- If a GoVenture activity carries more weight or importance than other course components, consider assigning it a proportionally higher grade percentage.
10.8 Asynchronous Online Course
Expand this section — click the black triangle
Suggestions on how to enhance asynchronous online courses:
- Doing live debriefs is very useful, but if you are not allowed to do anything live, then consider posting a recorded video of yourself reviewing and commenting on the results of each period (or every few periods).
- If using a discussion board, post questions from our Winning Strategies (see User Guide) so that students can reflect on their own strategies and perhaps post back.
- Consider having students submit the Student Experience Report as part of their assessment. You may also want them to record a video of themselves presenting their report (see above — Section 5 ).
- If playing in teams, smaller teams of 2 or 3 are better to make student meetings easier to schedule and conduct. And allow a few days or more in between periods.
- Review this article and video on building camaraderie with students — Creating Student Camaraderie & Teamwork In Online Courses